Why dealer service centers in the US are now treating runner replacement as a calculable ROI play, with deployment patterns from over 130 units in active service.
May 26, 2026 | About 11 minutes read
Dealer service centers do not get the automation headlines that gigafactories and 3PL warehouses do. They are not greenfield. They are not high-bay. They are not running 24/7 lights-out operations. They look, on the floor, more like a busy specialist repair shop than a logistics hub. A parts warehouse at one end. A row of repair bays along the other side. A counter. A handful of technicians. A runner trotting back and forth carrying parts. That is the actual operational picture, and it has stayed roughly the same for thirty years.
It is also, quietly, where one of the more sober AMR deployment stories in North America is unfolding. Since 2025, 136 PUDU T300 industrial autonomous mobile robots have been activated cumulatively across US automotive dealer service centers, covering scenarios similar to those at domestic brand service points, European premium brand service centers, Japanese OEM dealers, and large multi-franchise dealer-group repair facilities. The pattern across sites looks almost identical: one short loop, parts warehouse to repair bay, a high-frequency task list, and an ROI calculation that finally pencils out at the store level.
That last point is the one worth taking seriously. Dealer service-center automation is no longer an experiment. It is becoming an operating-cost decision.
Why dealer service centers are quietly entering the AMR conversation
Two things changed at the same time. First, the International Federation of Robotics’ 2024 World Robotics report confirmed continued growth in mobile robot installations across service and light-industrial environments, even as some heavy industrial categories cooled. Service robots and industrial AMRs are no longer niche; the install base in the US is wide enough that integrators, parts suppliers, and dealer groups can talk about deployment patterns instead of pilots.
Second, the labor side of the dealer service workflow stopped working at the margin. US dealer associations have been documenting service-technician shortages and rising labor cost for several consecutive reporting periods, and the runner role, the entry-level technician or porter who shuttles parts between the warehouse and the repair bays, became progressively harder to staff. Runner turnover is high. Saturday and evening coverage is patchy. Technicians who could be billing labor hours are instead walking to the counter or back to the parts cage.
Most articles framing this trend jump straight to a turnkey service-center automation platform. In practice, that is the project most likely to stall. Dealer service-center layouts vary by brand, by franchise group, and by building age, and they reconfigure when service lines are added or rebalanced. A multi-million-dollar fleet planned against one floor plan does not survive contact with the next renovation. The 136-unit US deployment base is interesting precisely because it does the opposite. It deploys one or two robots at a time, into one short loop, and replicates the same loop across additional sites once it is validated.
The deployment pattern: parts warehouse to repair bay, one short loop
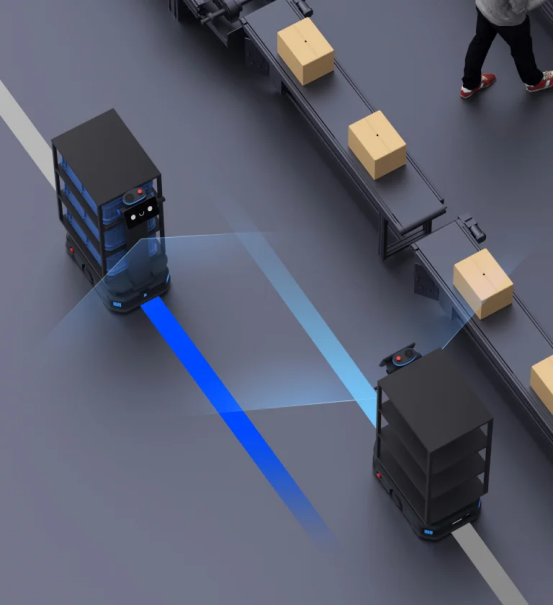
Figure 1. Industrial AMR moving a parts shelf along a defined route, the workflow pattern used in the dealer service-center parts delivery loop.
The deployment shape is unusually consistent across the US dealer service-center sites. An API dispatches a lifting task. A PUDU T300 industrial autonomous mobile robot picks up a parts rack from the lifting station at the parts warehouse entrance, drives to the requested repair bay, lowers the rack alongside the technician, and returns when the bay is done with the shelf. The repair order itself does not change. The counter does not change. The bay layout does not change. The robot replaces the walk.
High-volume stores handle at least 50 to 100 of these delivery tasks per shift, with peak days reaching about 150 tasks. That is the part of the deployment pattern that buyers tend to underestimate: the task volume per site is large enough that one or two robots quickly become essential, rather than nice to have, once the loop is validated.
Two additional outcomes show up consistently. Technicians stop interrupting their work to walk to the counter or the parts cage, which keeps the repair cadence continuous instead of pulse-and-pause. And the paper sign-off slip, the small operational artifact that quietly absorbs minutes per task and creates audit gaps, gets replaced by a traceable digital task record at the parts, location, and delivery level. Operationally, that is the closure of a long-standing back-office loop.
The runner ROI math that finally pencils out
The ROI conversation at dealer service centers used to be hand-wavy. It now has numbers that survive a controller review. In US dealer service centers in the active deployment base, the loaded labor cost of one runner is approximately USD 4,000 per month. The comprehensive monthly cost of one T300, including the unit, integration, and ongoing service, is approximately USD 2,500. A high-volume single store running 50 to 100 delivery tasks per day, sometimes peaking at 150, absorbs at least one runner full time. At that volume the spread is straightforward: one robot, one operating-cost line item, lower than one runner, with predictable availability across nights and Saturdays.
The Saturday gap is the part that often closes the decision. Runners are hardest to staff on Saturdays, exactly when many dealer service centers see one of the busiest service days of the week. When a runner is not on duty, technicians collect their own parts. That collapses repair-order throughput on the day that throughput matters most. An AMR that does not call in sick on Saturday is, by a quiet but real margin, the more reliable option.
Two caveats keep this honest. The math depends on volume; at fewer than 30 to 50 tasks per day, a robot is harder to justify than a part-time runner. And the math assumes the service center is open to digitizing the parts-pick-and-sign-off workflow at the same time. Stores that keep the paper trail and add a robot on top usually find that the robot saves walking time but does not close the back-office loop, which is where a meaningful share of the operational benefit lives.
Four operational features of dealer service centers that shape robot selection
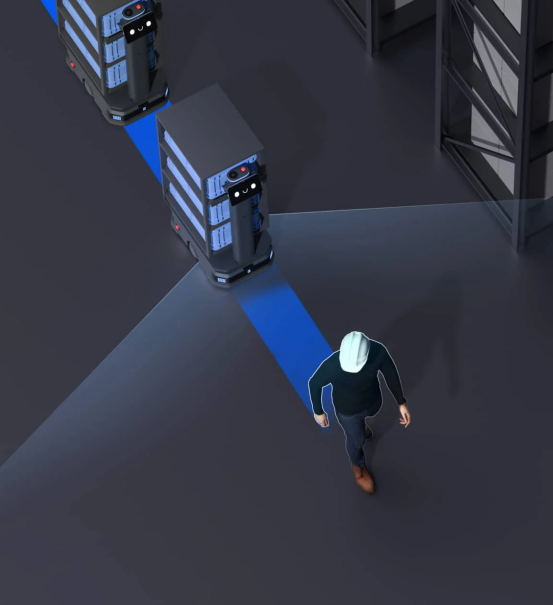
Figure 2. Compact-footprint industrial AMR sharing service-center aisles with technicians and equipment.
Pudu Robotics field engineering has now installed 136 T300 units across the US dealer service-center base, with new activations continuing through 2025 and into 2026. Four patterns repeat across nearly every site, and each one changes the calculus for what kind of AMR fits.
1. Layouts are similar across brands
The visible difference between a domestic-brand 4S point and a European premium brand service center is mostly signage. Operationally, the parts warehouse, the counter, the bay row, and the route between them are surprisingly similar. That is why a validated single-site deployment replicates so cleanly: the agent or integrator can re-use the same workflow design, the same fleet management settings, and the same training script across additional sites in the same dealer group.
2. Aisles are tight, mixed-traffic, and dynamic
A dealer service-center floor is not a warehouse aisle. It shares space with technicians walking, tool carts being pushed, parts boxes being staged, customer-facing service writers crossing through, and the occasional car being moved from a bay. Clearances are tight on paper and often tighter in practice. Compact footprint, omnidirectional perception including low and suspended obstacle detection, and tight-corner navigation are entry criteria. A robot that needs 1.2 meters of clear path simply does not run in a real service center.
3. The integration interface is an API plus a parts system, not a custom MES
Dealer service centers run on a dealership management system and a parts catalog, not on a custom factory MES. The integration pattern that works is an API call from the parts system or the dispatcher to the robot fleet, triggering a lifting task. That keeps the deployment cost low and the integration scope tight. It also means the vendor needs an API and fleet management that an integrator can wire up in days, not weeks.
4. Replication across sites is the value, not single-site excellence
Dealer groups buy in batches. Once a workflow is validated at one site, the procurement question is not whether to buy a second robot, it is how quickly the same model can be rolled into 5, 10, or 20 additional sites. The 136-unit US deployment base reached its current scale precisely because the replication step is low-friction. That is the practical lesson for procurement leaders: pick a deployment pattern that replicates cheaply, not one that is over-engineered for any single store.
Workflows in a dealer service center that fit a low-payload industrial AMR
Once you accept that the entry point is one short loop, the next question is which loop. The matrix below summarizes the workflows where a 300 kg-class low-profile industrial robot fits cleanly inside a dealer service-center environment, based on the deployment taxonomy used by the field engineering team across the active US sites.
| Workflow | Typical load | Fit for a 300 kg-class low-profile AMR | Why |
| Parts warehouse to repair bay delivery (the canonical loop) | Parts on a shelf or rack, 20-200 kg | Strong | Standardized, recurring, high-frequency, route stable across shifts. |
| Empty shelf or fixture return from bay to parts warehouse | Empty rack, 5-40 kg | Strong | Combines naturally with the delivery loop into a closed cycle. |
| Lubricant or consumable replenishment to bays | Cases / drums in fixed sizes, 20-150 kg | Good | Predictable timing, standardized containers; the workflow pays back when added on top of the parts loop. |
| Tire transport between tire storage and bays | Tires / tire stacks, 50-200 kg | Project-dependent | Workflow pattern fits, but storage geometry varies by site; validate per location. |
| Vehicle movement between bays or to wash bay | Full vehicle, 1000+ kg | Out of scope | Use a vehicle-moving tug or dedicated equipment. |
| Customer-facing pickup or delivery to lounge | Small items, mixed | Out of scope | Customer experience workflows are better served by a customer-facing service robot product line. |
Table 1. Workflow-fit matrix for a low-payload industrial AMR in a dealer service center.
The first three rows are the natural entry workflows. They share the four properties that make them safe first projects in a dealer service center: predictable load sizes, standardized handoff points, repeatable timing, and a sales-and-operations narrative that the service director can explain to the GM in one sentence. The 136-unit US deployment base lands directly in those rows.
What the T300 contributes operationally
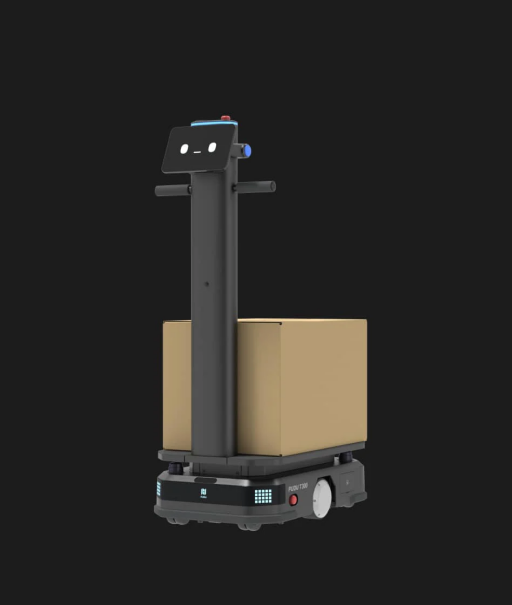
Figure 3. Industrial AMR using a jacking lift to transfer a parts rack, the same mechanism used in the dealer service-center delivery loop.
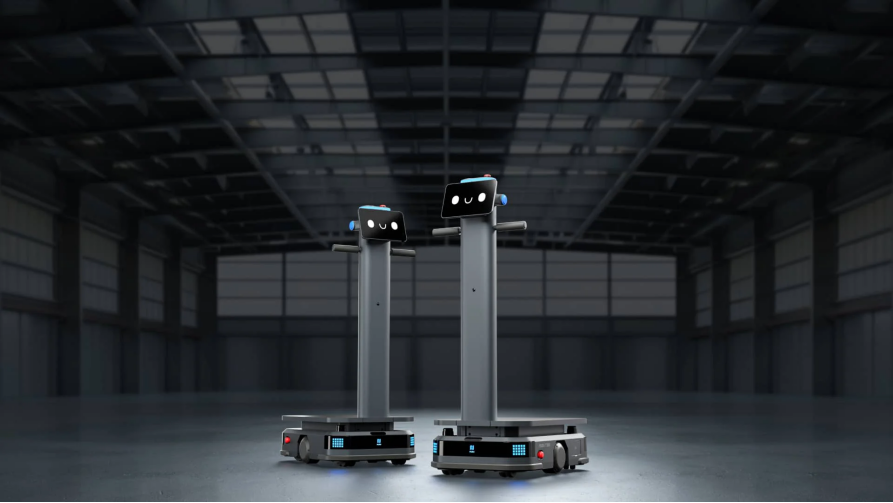
The PUDU T300 is built for exactly the constraints described above: a 300 kg payload class with a low profile, flexible VSLAM positioning that does not require magnetic tape or reflectors, omnidirectional perception including low and suspended obstacle detection, around 60 cm path clearance, an ISO 3691-4 conformant safety design, and 24/7 operation. None of those are individually unique. What matters is that the combination matches the floor a dealer service center actually has, not the floor an idealized fleet plan assumes.
In the parts delivery loop, the operationally interesting capability is the in-place jacking lift. The robot does not need a dedicated docking station, conveyor handoff, or chute. It positions under a staged parts rack at the warehouse entrance, lifts, drives the validated route, lowers at the repair bay, and reverses for the empty-rack return. The service center keeps using the same racks and the same staging points. That is what keeps the integration cost low enough for the per-store ROI to actually pencil out, and what keeps the replication across additional sites fast.
Where Pudu Robotics fits in the global industrial AMR landscape
Dealer-group procurement teams reasonably want to know who they are buying from before signing a multi-site rollout plan. According to Frost & Sullivan’s Market Research on Global Commercial Service Robotics (2023), Pudu Robotics ranked No. 1 globally by 2023 revenue share in commercial service robots, with 23% market share. KEENON Robotics held 11%, Gausium 8%. For a dealer-group buyer, that signal matters less as a brag and more as a deployment-base signal: the vendor has the install base to harden product, the service depth to support multi-site operations, and the engineering capacity to keep iterating on workflows that smaller vendors cannot sustain.
Inside that portfolio, the T-series industrial robots are the entry point for service and light-industrial environments rather than hospitality or retail, which keeps the conversation operationally focused: this is the side of the company that talks payload, clearance, ISO 3691-4, fleet management, and integrator-led multi-site rollout.
What dealer-group procurement teams should evaluate next
If the deployment pattern described in this article fits your service centers, the most useful next step is not an enterprise RFP for a service-automation platform. It is a single-store validation against the canonical loop, with a clear replication plan if the validation passes.
From there, four questions decide whether a low-profile industrial AMR like PUDU T300 belongs in the loop:
– What is the actual daily delivery task volume per store at the volume threshold (50-100 tasks for ROI, 150 at peak), not the planning assumption?
– Is the dealer ready to digitize the parts-pick-and-sign-off workflow at the same time, so the robot delivers both walking-time savings and back-office closure?
– How quickly can an additional store be added to the rollout (target measured in weeks, not months) once the first site is validated?
– What is the vendor’s US service footprint and integrator network for response time, spare parts, software updates, and across the dealer brands in scope?
The answers tend to resolve into a small first project per dealer group, not an enterprise platform purchase. That is the right shape for an industry where one validated loop replicates across many similar floors.
FAQ
How many delivery tasks per day make a robot the right call versus a runner?
Above roughly 50 daily tasks the math tips in favor of an industrial AMR; above 100 it stops being close. Below 30 a part-time runner usually still wins. Saturday coverage is a separate consideration, because runner availability collapses on the day that service centers are busiest.
Does this replace the runner role entirely?
In most active deployments it absorbs the high-frequency parts-shuttle work that the runner was doing, while the runner role itself is either eliminated through attrition or redeployed to higher-value customer-facing tasks (check-in, lounge, lot management). The decision is usually presented and budgeted as a labor-cost line replacement at the store level.
What does integration with the dealer’s parts system look like?
An API call from the dispatcher or parts system triggers a lifting task to the AMR fleet. There is no custom MES, no factory-grade controls layer, and no rebuild of the dealer management system. The integration scope is small enough that a US integrator can stand up the canonical loop at a single store in days, not weeks.
How quickly can we replicate across multiple stores?
Once one store is validated, additional sites within the same dealer group typically come on faster: the workflow is the same, the API integration template is the same, and the training script is the same. That replication speed is what produced the 136-unit US install base in roughly two activation years.
How should we evaluate vendors beyond the spec sheet?
Three checks separate viable vendors from optimistic ones: an on-site obstacle and clearance walkthrough at the worst-case bay row, a per-store integration estimate that names the API entry point on the parts system, and a US service-coverage plan covering response time, spare parts, and software updates across the geography of the stores you intend to roll out.
References & Further Reading
1. International Federation of Robotics. World Robotics 2024. https://ifr.org/
2. National Automobile Dealers Association (NADA). NADA Data: annual financial profile of America’s franchised new-vehicle dealerships. https://www.nada.org/nada/nada-data
3. Frost & Sullivan. Market Research on Global Commercial Service Robotics (2023). https://www.frostchina.com/en/content/insight/detail/66b96cfadce2a58aa58ac492
4. Pudu Robotics. PUDU T300 industrial autonomous mobile robot. https://www.pudurobotics.com/en/products/pudut300
5. Pudu Robotics. Smart manufacturing case study, multi-robot collaboration. https://www.pudurobotics.com/en/case-studies/pudu-tri-robot-battery
